Debugging Scripts
- Ivaylo Fiziev
- Sep 25, 2023
- 4 min read
Updated: Oct 3, 2023

Debugging is never a trivial task. You need a way to stop the execution of the code and examine the state inside. Usually this involves checking the call stack, monitoring the values of local variables and evaluating expressions in the current stack frame. But how do you stop the code in the first place? What is a stack frame? How to connect to the script?
Obviously you need a debugger for this. But how to implement one? Most of us have never had a chance to get into the topic of building development tools. This is a "reserved" territory for masters and gurus no-one has ever met. I am sure you think they do not even exist. Well I used to think the same until I was faced with the task to implement a debugger for SCL. Even the idea of it was overwhelming. Who am I to mess with debugging? It took me a while to calm down and accept the mission. And there I was on my new journey.
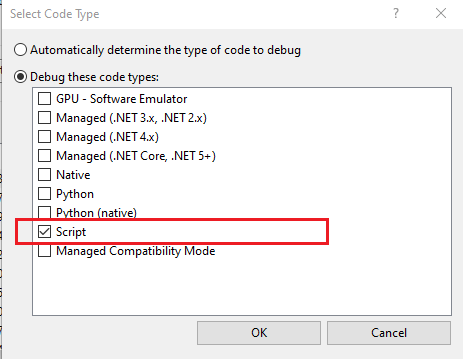
Initially I thought I can reuse an existing debugger. Visual Studio was the number one choice of course … and believe it or not it almost worked. It is capable of debugging scripts. You just attach to the hosting process choosing the script debug engine first:

I am sure no one has ever done this right? We are all quite used to debugging native/managed code but who the hell will debug scripts? I didn't even know this was possible?!? Anyway I started exploring my options here and soon realized that this wasn't the right path to go. After fighting with Visual Studio for a while I came up with the following conclusions:
Visual Studio is a payed product and not all customers will have it.
Visual Studio has several versions and each version has it's own bugs. We cannot rely on this.
Visual Studio sometimes expects a concrete behavior from the scripting engine that we provide and this behavior is not widely documented. This will make our life miserable.
So I went for another option: The legacy "Microsoft Script Debugger" which of course was ridiculous in nature. Very old and very limited tool. So again a dead end.
During this time I was playing at home with a open source project that helps you easily build Visual Studio like UIs - Gemini Framework (https://github.com/tgjones/gemini). I was trying to create a development environment for SCL scripts. Gemini looked promising and modern so I quickly got it working. I kept the project in a local repo for a while and once I failed to find a proper debugger application it just hit me: I could use Gemini to build my own debugger. Wow. What an idea... but first I had to understand how debuggers work... it took me about two years as a side activity in my day-to-day work. Eventually I presented the debugger as an innovation project inside the team.
But how it actually works? Pretty simple. Microsoft provides an API for this. The same API that Visual Studio uses as well for everything related to debugging. An essential component in their design is the Process Debug Manager (PDM). It is delivered along with Visual Studio itself or the Remote Tools for Visual Studio.
By definition: PDM manages programs and processes, making them available to the session debug manager and the debug engines.
Simply said: it connects the script engines with a debugger application via standard API. Then the API allows the debugger to extract the state of the script and present it to the user once a breakpoint is hit.
The PDM acts like a registry where all running scripts are registered along with the related script engines. The debugger application gains access to these and therefore can display the script and query the related script engine for its state. The state involves: enumerating code contexts (language statements), stack frames (entries in the call stack), stack frame properties (local variables), evaluating expressions within a stack frame (expression watch) etc. The script engine is responsible for maintaining and delivering all this data to the debugger.
But how does the debugger gets access to the PDM? Well... it attaches to the process that contains the script engine.
When the process registers a script within the PDM, an event is fired to the debugger application letting it know that a new script is available. The debugger can then enumerate the code contexts within the scripts. A code context is actually the abstraction of an instruction pointer. It usually points to a language statement.
The code context allows the debugger to identify the statement and most importantly to put/remove a breakpoint on it. The script engine then checks for breakpoints while executing the statements within the code. If the next statement has a breakpoint on it the engine calls the debugger application using a synchronous call that returns when the debugger application resumes the execution. Until then the calling thread is blocked.
On return this synchronous call brings a number (enum) that tells to the engine how to continue the execution (step into, step over, step out, continue) then the engine ensures the behavior. The script execution can also be suspended using a debugger halt. Once initiated the debugger halt is handled just like a regular breakpoint. The code just stops at the current statement.
What happens once the code stops?
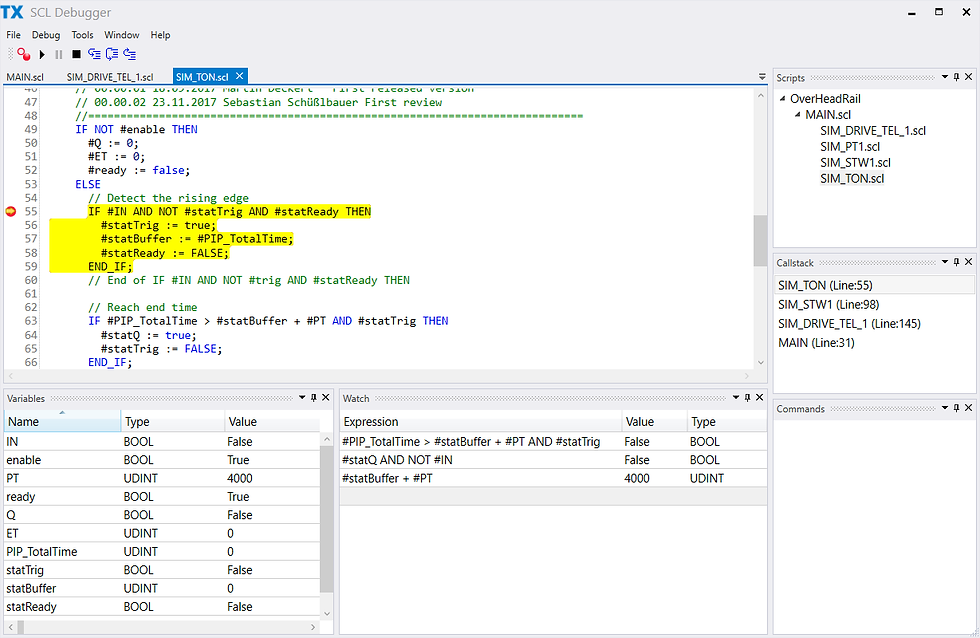
The debugger application enumerates the current stack frames. Each stack frame is a "window" allowing you to look inside the state of a running function. Basically this means to enumerate the variables that are currently in scope. Also you can evaluate expressions in the current scope. This is what allows the debugger to populate its UI showing you the state.
Eventually it looks like this:

The PDM allows also to get the list of threads executing scripts. This however is not available still since all SCL scripts in Process Simulate run sequentially on the same thread.
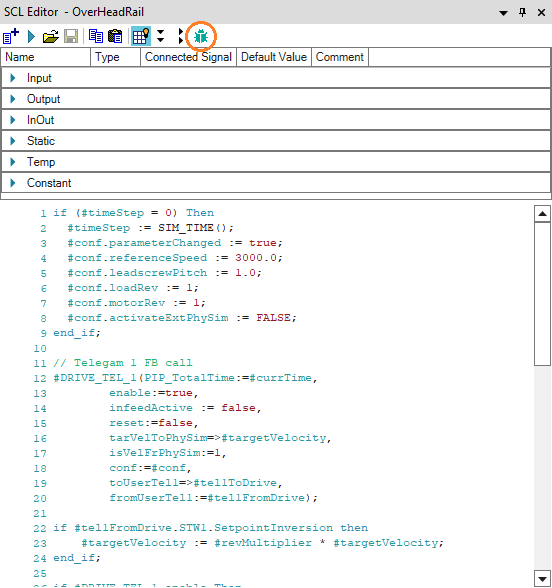
How to trigger the debugger? Just toggle the debug button in the SCL editor before simulation starts.

That is it. You have just learnt what I did in two years. The implementation is of course not that trivial but the idea is simple. The debugger is there if you want to try it.
Enjoy!


Comments